Cosmology - Universe Wide
Cosmology considers large structures and the universe as a whole.
Timeline
Ref: https://en.wikipedia.org/wiki/Chronology_of_the_universe#Tabular_summary
1 Ga = 1 billion years or giga-annum (109 years)
| Epoch |
Time |
Redshift |
Temperature |
Description |
|---|---|---|---|---|
| Radiation-dominated era |
From inflation (~ 10−32 sec) ≈ 47 ka | > 3600 |
> 104 K |
During this time, the energy density of massless and near-massless relativistic components such as photons and neutrinos, which move at or close to the speed of light, dominates both matter density and dark energy. |
| Matter-dominated era |
47 ka ~ 9.8 Ga | 3600 ~ 0.4 |
104 K ~ 4 K |
During this time, the energy density of matter dominates both radiation density and dark energy, resulting in a decelerated metric expansion of space. |
| Dark-energy- dominated era |
> 9.8 Ga | < 0.4 |
< 4 K |
Matter density falls below dark energy density (vacuum energy), and expansion of space begins to accelerate. This time happens to correspond roughly to the time of the formation of the Solar System and the evolutionary history of life. |
| Anthropocene | 13.8 Ga | You are Here | ||
| Stelliferous Era | 150 Ma ~ 100 Ga | 20 ~ −0.99 | 60 K ~ 0.03 K |
The time between the first formation of Population III stars until the cessation of star formation, leaving all stars in the form of degenerate remnants. |
| Far future | > 100 Ga | < −0.99 |
< 0.1 K |
The Stelliferous Era will end as stars eventually die and fewer are born to replace them, leading to a darkening universe. Various theories suggest a number of subsequent possibilities. Assuming proton decay, matter may eventually evaporate into a Dark Era (heat death). Alternatively the universe may collapse in a Big Crunch. Other suggested ends include a false vacuum catastrophe or a Big Rip as possible ends to the universe. |
You can see more at https://www.sciencealert.com/timeline-shows-the-entire-history-of-the-universe-and-how-it-ends.
Composition and Structure of the Universe
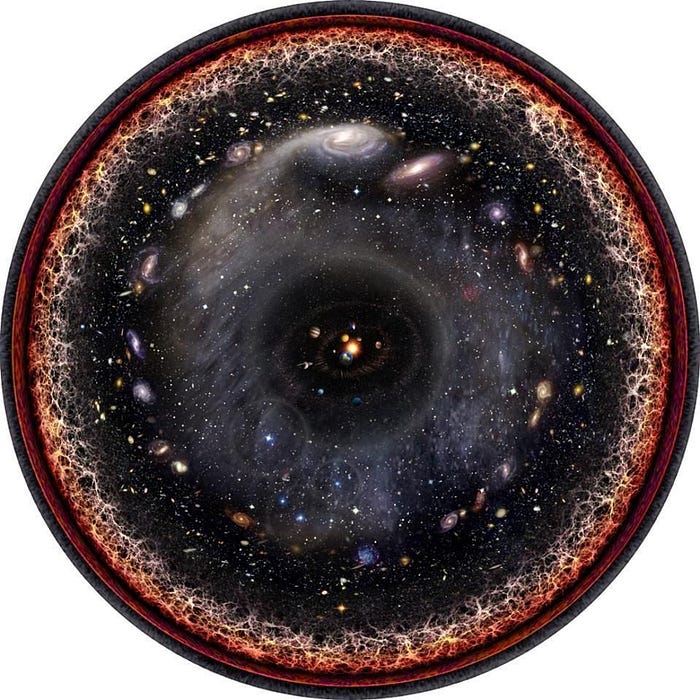
The observable Universe is bigger than 13.8 billion light years
as the universe is expanding.
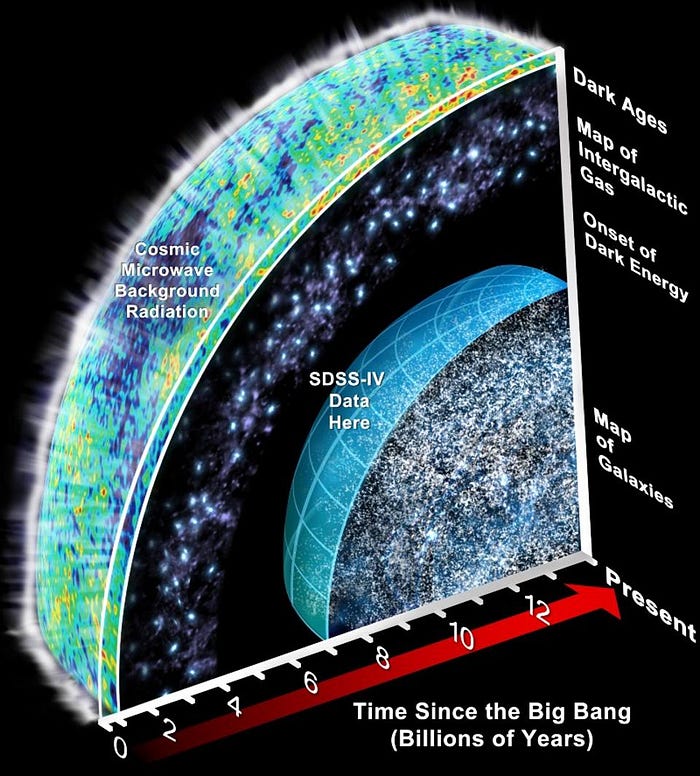
In physical cosmology, structure formation is the formation of
galaxies, galaxy clusters and larger structures from small early
density fluctuations. This is best assessed by The cosmic
microwave background (CMB, CMBR).
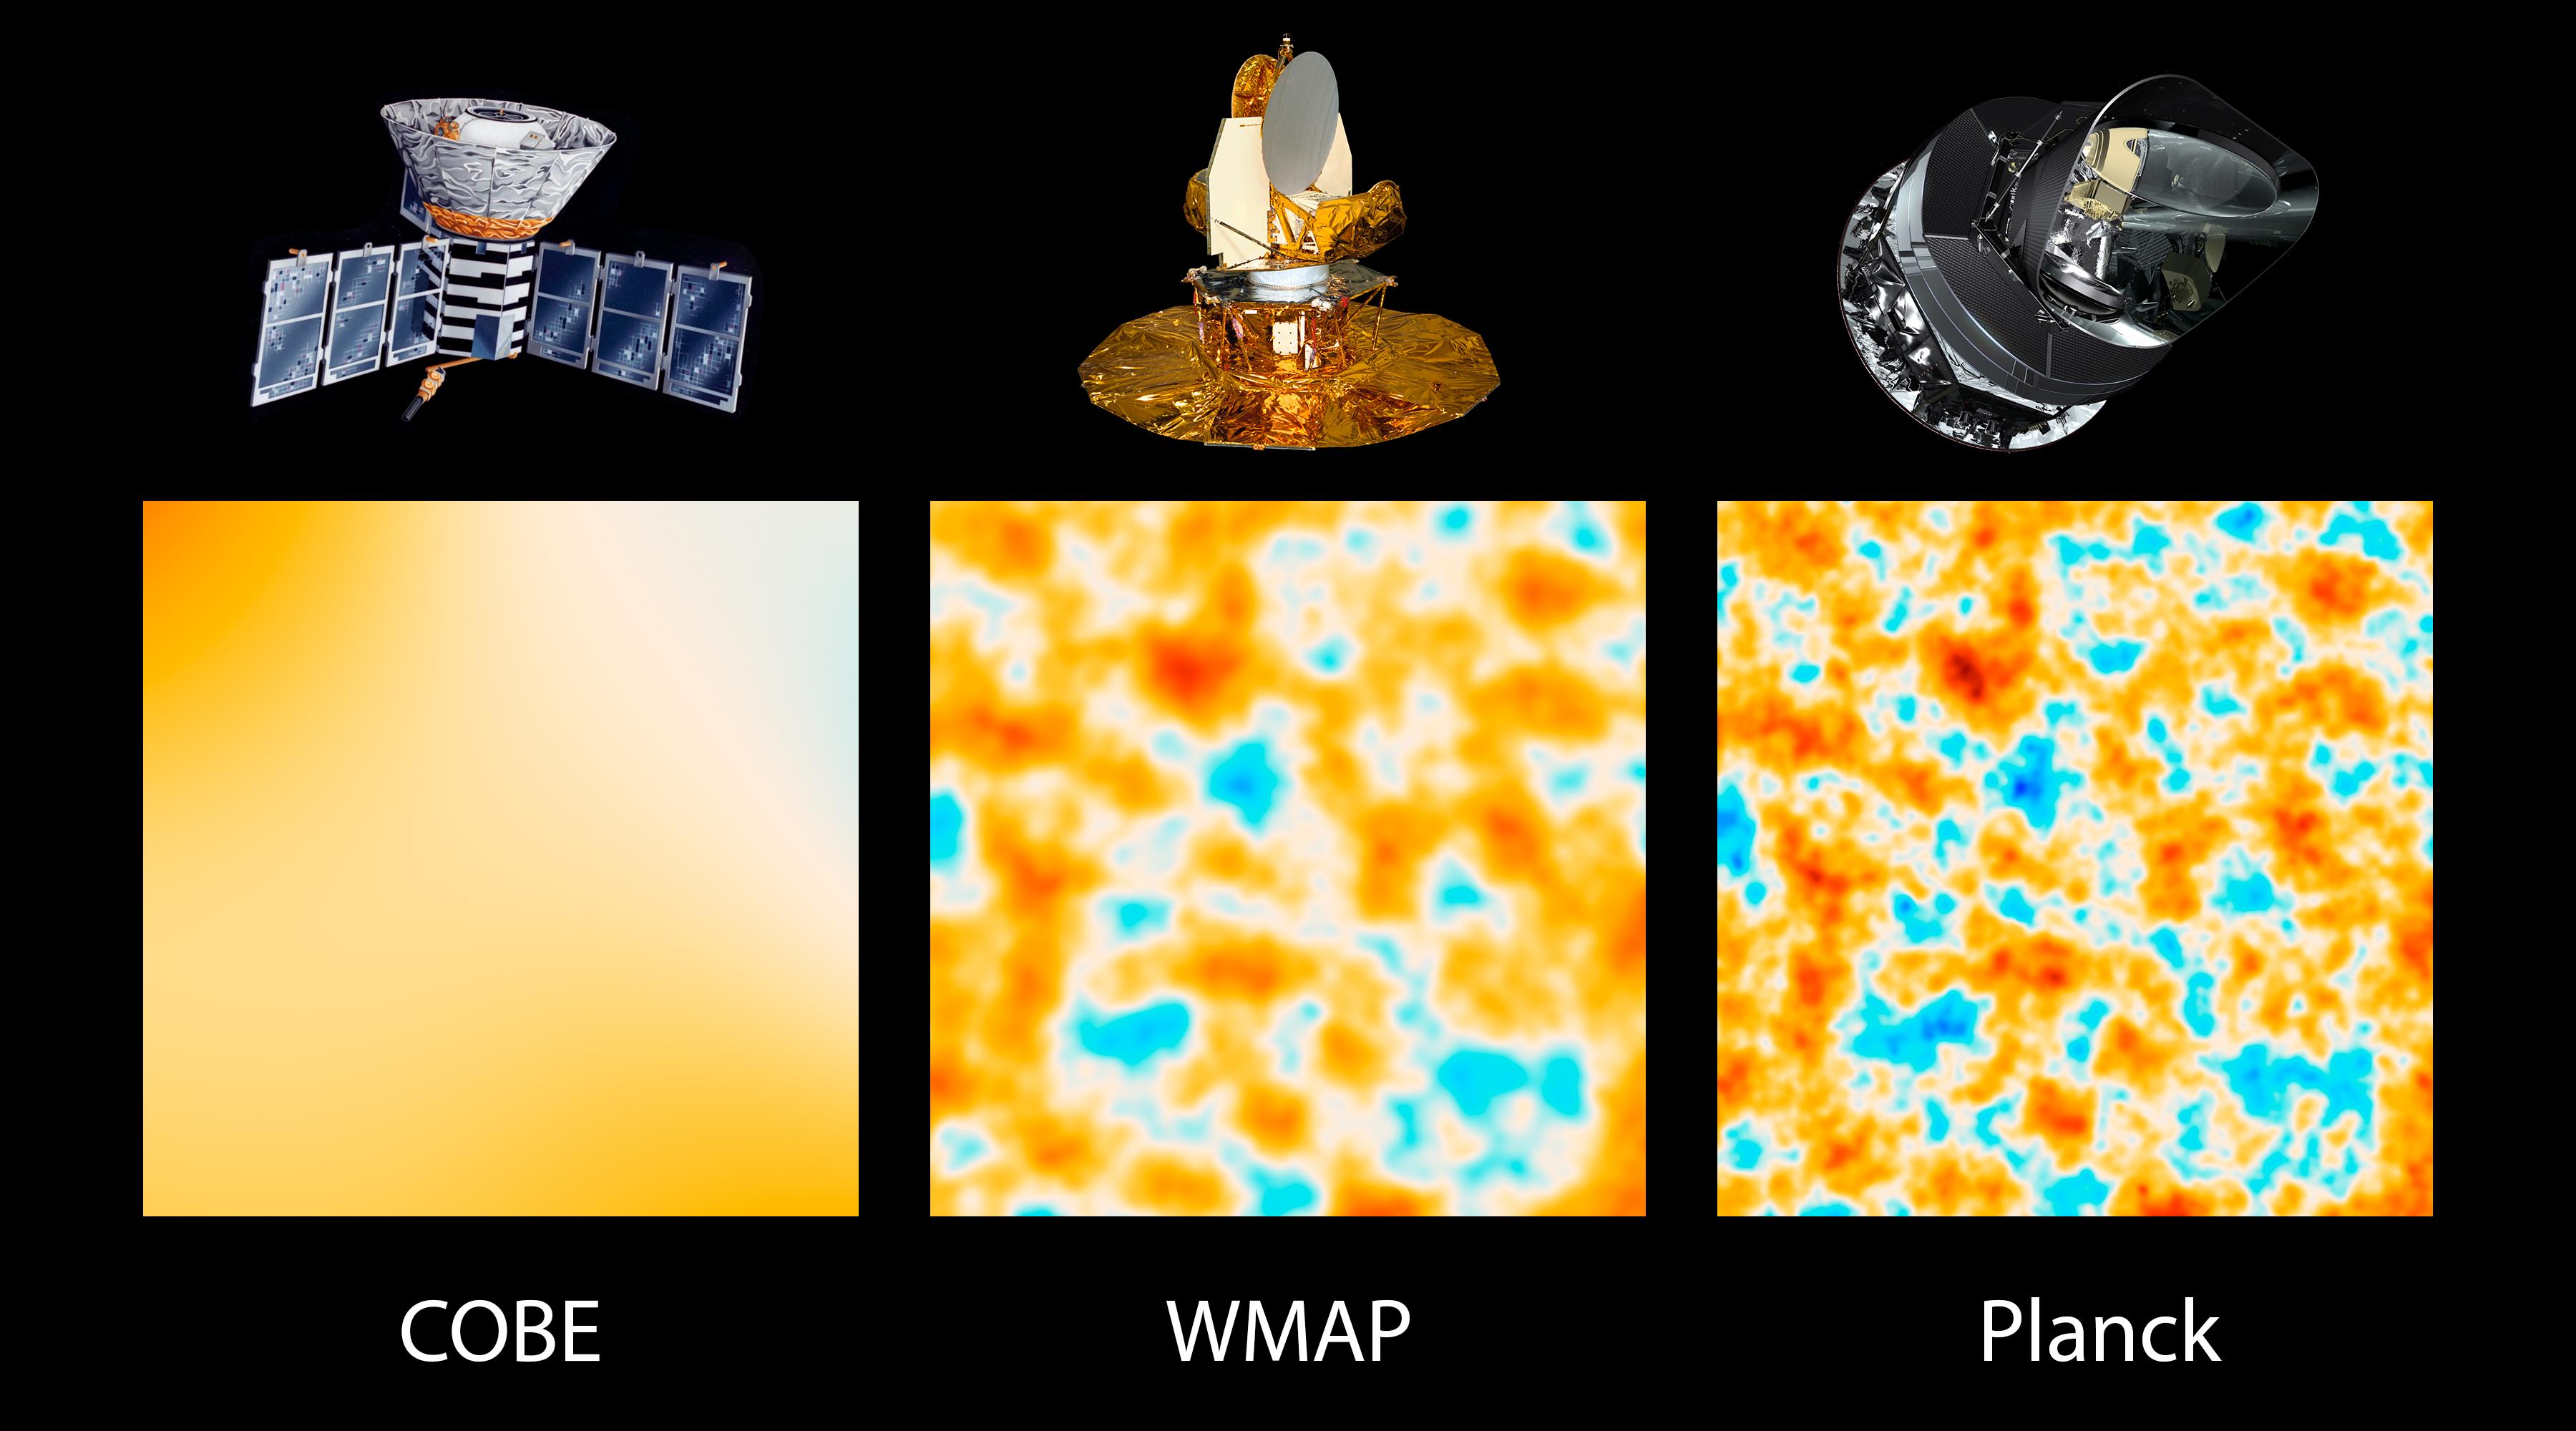
The most famous experiment is probably the NASA Cosmic Background
Explorer (COBE) satellite that orbited in 1989–1996 and which
detected and quantified the large scale anisotropies at the limit
of its detection capabilities. In June 2001, NASA launched a
second CMB space mission, WMAP, to make much more precise
measurements of the large scale anisotropies over the full sky.
WMAP used symmetric, rapid-multi-modulated scanning, rapid
switching radiometers to minimize non-sky signal noise. A third
space mission, the ESA (European Space Agency) Planck Surveyor,
was launched in May 2009 and performed an even more detailed
investigation until it was shut down in October 2013.
Based on the 2013 Planck data, the universe contains 4.9%
ordinary matter, 26.8% dark matter and 68.3% dark energy. On 5
February 2015, new data was released by the Planck mission,
according to which the age of the universe is 13.799±0.021 billion
years old and the Hubble constant was measured to be 67.74±0.46
(km/s)/Mpc.[82]
 Ref: https://en.wikipedia.org/wiki/File:Observable_Universe_with_Measurements_01.png |
 Ref: https://photojournal.jpl.nasa.gov/catalog/PIA16874  Ref: https://www.nasa.gov/images/content/735683main_pia16873-full_full.jpg |
 Ref: PABLO CARLOS BUDASSI |
|
 Ref: PABLO CARLOS BUDASSI |
 Ref: Sloan Digital Sky Survey |
Distance Measurements
1 AU = 1.495978707×10¹¹ m = Distance from
Earth to Sun
1 light year = 9.460 730 472 5808 x 1015 m
1 parcec = 3.26156 light years = 1/tan(1/3600
deg) * 1 AU = 3.0856775814913673×10¹⁶ m =
distance at which 1 au subtends an angle of one arcsecond
1 z = red shift
Mass Measurement
M☉=
Mass Sun
Reference
Chronology
of
the
universe - Wikipedia
Observable
universe
-
Wikipedia
Cosmic
microwave
background
- Wikipedia
Universe Structure
| Structure |
Number |
Size |
Number of Galxies |
Description |
| Observable Universe |
2 x 10¹² |
|||
| Galaxy Filaments/Super Clusters |
~10 million | 160 to 260 (520?) million light-years |
Structure of super clusters |
|
| Laniakea Supercluster |
520 million light-years | 100,000 galaxies |
||
| Virgo Supercluster |
110 million light-years |
47,000 galaxies. |
||
| Local Group |
3 megaparsecs (10 million light-years; 9×10²²
metres), |
~ 89 galaxies |
ref: Galaxy
filament
-
Wikipedia, Supercluster -
Wikipedia, Local Group -
Wikipedia, Medium
-
How Much Of The Unobservable Universe Will We Someday Be Able To
See?
Galaxy Filaments
ref: Galaxy
filament
-
Wikipedia
In cosmology, galaxy filaments (subtypes: supercluster complexes,
galaxy walls, and galaxy sheets) are the largest known structures
in the universe, consisting of walls of gravitationally bound
galaxy superclusters. These massive, thread-like formations can
reach 80 megaparsecs h−1 (or of the order of 160 to 260
million light-years) and form the boundaries between large voids.
 ref: The Universe within 500 million light years, showing the nearest galaxy walls. |
 ref: 1280px-Large-scale_structure_of_light_distribution_in_the_universe |
Super Clusters
A supercluster is a large group of smaller galaxy clusters or
galaxy groups;[1] it is among the largest known structures of the
universe. The Milky Way is part of the Local Group galaxy group
(which contains more than 54 89 galaxies), which
in turn is part of the Virgo Supercluster, which is part of the
Laniakea Supercluster.[2] The large size and low density of
superclusters means that they, unlike clusters, expand with the
Hubble expansion. The number of superclusters in the observable
universe is estimated to be 10 million.
Local Group
| Spiral galaxies | ||||||
|---|---|---|---|---|---|---|
| name | type | Distance |
Diameter |
Mass |
Stars |
notes |
| Andromeda Galaxy (M31, NGC 224) | SA(s)b | 2.73 million light-years | 220 kly | (1.5±0.5)×1012 M☉ | ca. 1012. | Largest galaxy in the group |
| Milky Way Galaxy | SBbc | NA |
175±25 kly | (1.54±0.1)×1012 M☉ | (2.5±1.5)×1011. |
Second largest galaxy in the group, which may or may not be the most massive galaxy of the group. |
| Triangulum Galaxy (M33, NGC 598) | SA(s)cd | 2.73 million light-years | 60 kly | 5×10¹⁰ M☉ | 4×10¹⁰ | Third largest, only unbarred spiral galaxy and possible satellite of the Andromeda Galaxy. |
| Magellanic Spiral Galaxies | ||||||
| Large Magellanic Cloud (LMC) | Irr/SB(s)m | 160,000 light-years |
14 kly | 1×10¹⁰ M☉ | Fourth largest member of the group, satellite of Milky Way and only Magellanic Spiral Galaxy in the local group | |
| NGC 3109 | SB(s)m | Member of Antlia-Sextans Group | ||||
| Elliptical galaxies | ||||||
| M32 (NGC 221) | E2 | Satellite of the Andromeda Galaxy, shows signs of a supermassive black hole | ||||
| Irregular galaxies | ||||||
| Wolf–Lundmark–Melotte (WLM, DDO 221) | Ir+ | |||||
| IC 10 | KBm or Ir+ | |||||
| Small Magellanic Cloud (SMC, NGC 292) | SB(s)m pec | 7 × 10⁹ M☉ | Satellite of Milky Way, 6th largest galaxy in the local group | |||
| Canis Major Dwarf | Irr | Satellite of Milky Way | ||||
| Pisces Dwarf (LGS3) | Irr | Possible satellite of the Triangulum Galaxy | ||||
| IC 1613 (UGC 668) | IAB(s)m V | |||||
| Phoenix Dwarf | Irr | |||||
| Leo A (Leo III) | IBm V | |||||
| Aquarius Dwarf (DDO 210) | IB(s)m | Distance 3.2 million light years. Quite isolated in space, membership to Local Group established in 1999.[12] | ||||
| SagDIG (Sagittarius Dwarf Irregular Galaxy) | IB(s)m V | Most remote from barycenter member thought to be in the Local Group.[12] | ||||
| NGC 6822 (Barnard's Galaxy) | IB(s)m IV-V | |||||
| Pegasus Dwarf (Pegasus Dwarf Irregular, DDO 216) | Irr | |||||
| UGC 4879 (VV124) | IAm | One of the most isolated galaxies in Local Group. Situated at the edge of the Local Group. | ||||
| Sextans A (UGCA 205) | Ir+V | Member of Antlia-Sextans Group | ||||
| Sextans B (UGC 5373) | Ir+IV-V | Member of Antlia-Sextans Group | ||||
| Leo P | Irr | Member of Antlia-Sextans Group | ||||
Astrophysics
Astrophysics creates physical theories of small to medium-size
structures in the universe
Types of Galxies - Hubble Sequence

Elliptical galaxies have relatively smooth, featureless light distributions and appear as ellipses in photographic images. They are denoted by the letter E, followed by an integer n representing their degree of ellipticity in the sky. By convention, n is ten times the ellipticity of the galaxy, rounded to the nearest integer, where the ellipticity is defined as $ e = 1 - {{a}\over {b}} $ for an ellipse with semi-major and semi-minor axes of lengths a and b respectively
Lenticulars and given the symbol S0. These galaxies consist of a bright central bulge, similar in appearance to an elliptical galaxy, surrounded by an extended, disk-like structure. Unlike spiral galaxies, the disks of lenticular galaxies have no visible spiral structure and are not actively forming stars in any significant quantity.
A spiral galaxy consists of a flattened disk, with stars forming a (usually two-armed) spiral structure, and a central concentration of stars known as the bulge. Roughly half of all spirals are also observed to have a bar-like structure, with the bar extending from the central bulge, and the arms begin at the ends of the bar. In the tuning-fork diagram, the regular spirals occupy the upper branch and are denoted by the letter S, while the lower branch contains the barred spirals, given the symbol SB.
- Sa (SBa) – tightly wound, smooth arms; large, bright central bulge
- Sb (SBb) – less tightly wound spiral arms than Sa (SBa); somewhat fainter bulge
- Sc (SBc) – loosely wound spiral arms, clearly resolved into individual stellar clusters and nebulae; smaller, fainter bulge
- Sd (SBd) – very loosely wound, fragmentary arms; most of the luminosity is in the arms and not the bulge
Irregular Galaxies do not fit into the Hubble sequence as they
have no regular structure (either disk-like or ellipsoidal).
Hubble defined two classes of irregular galaxy:
- Irr I galaxies have asymmetric profiles and lack a central bulge or obvious spiral structure; instead they contain many individual clusters of young stars
- Irr II galaxies have smoother, asymmetric appearances and are not clearly resolved into individual stars or stellar clusters
Taking the classification from Revised Shapley-Ames Catalog of
Bright Galaxies
(https://ned.ipac.caltech.edu/level5/Shapley_Ames/frames.html)
| Type |
Count | Percentage |
| E | 172 | 13.5% |
| S0/SB0 | 156 | 12.3% |
| S | 662 | 52.0% |
| SB | 242 | 19.0% |
| Irregular | 41 | 3.2% |
| 1273 | 100% |
Milky Way
datasets
| Calalogue |
Published |
Stars |
Coverage |
| Hipparcos Catalogue |
1997 |
118,200 |
|
| Tycho Catalogue |
1997 |
1 million |
|
| Tycho-2 Catalogue |
2000 |
2.6 million |
|
| Sloan Digital Sky Survey |
2008 |
48 million |
1/3 sky |
| Gaia Data Release 1 |
2016 |
1,142,679,769 |
|
| Gaia Data Release 2 |
2018 |
1,692,919,135 |
No comments:
Post a Comment